Plotify ®
Dynamic Drag-and-Drop Data Visualization
Easy interactive data visualization that helps you better understand your data and share it with others.
Drag-and-Drop
Drag-and-drop your plot settings and datasets into the Plotify Viewer to instantly visualize all of your data.
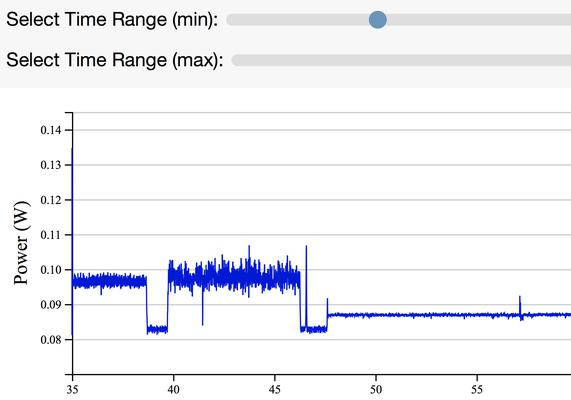
Interactive Control
Add custom controls to your plots - live data filtering and processing, variable selection and plot settings adjustment.
Conditional Formatting
Use the data to precisely control styles and formatting. E.g. change the colour of all points in the top 10 percent.
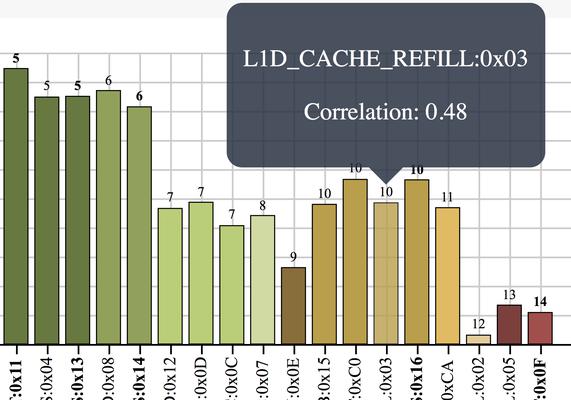
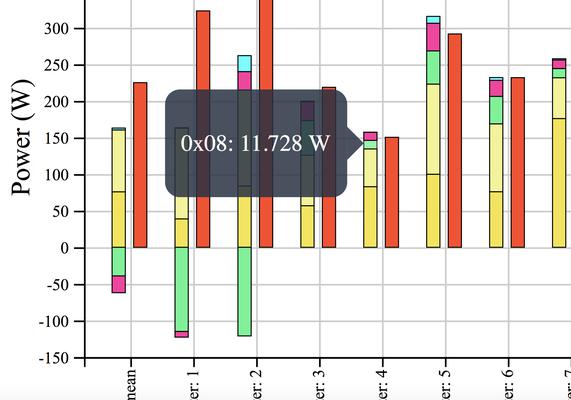
Annotation and Tooltips
Add custom labels to data points. Show a user-defined tooltip when a user hovers over a data point.
Interactive Stats
Built-in data-processing. Show live statistics about data points or ranges selected by the user.
One Plot, Many Datasets
Once a plot has been created, drag-and-drop as many dataset files as you want to automatically apply the plot.
Plotify is currently limited to a few users while we ramp up our infrastructure to support more of you! If you are interested in finding out more about Plotify or are interested in becoming a user, send an email to info@plotify.io.